
Most Dreaded Terror 13 China
I
It is the 19th of March, 2018. Here is the survival experience of Chinese dynasties.
Information taken from John B. Teeple TIMELINES OF WORD HISTORY, DK Publishing, New York, NY, 2006, page 554, 555
Yes these are dynasties, not civilizations. The first Chinese emperor was in about 200 BC. The line of emperors continued into the 20th century – always the same civilization. It makes the West look pathetic in comparison: three hundred year brick wall, indeed. Even the dynasties make Western civilizations look sick. For the first 200 years every dynasty looks almost – but not quite – invincible.
This long period of great stability depended on a remarkable strategy. (I am no expert on history, so I can only give you what I have heard.) Each year boys of a certain age were given a test on the sayings of Confucius. The bulk who did not excel could look forward to a life of very hard work, poverty and very little freedom. The ones who did best got a choice: stay poor or get castrated, in which case the qualified for work in the administration of the government. It would be as if we decided here to castrate all the doctors, lawyers, politicians, millionaires, university professors and scientists. I daresay that there are those who might favor such a plan, but don’t expect our overlords to start pushing it.
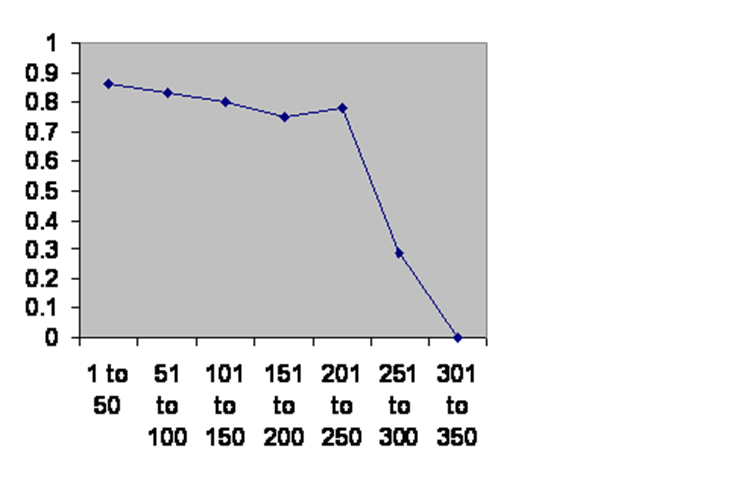
The upshot was that there were no powerful families. There was no concentration of power that might threaten the imperial house. Then over a hundred years they all collapsed. Just one appears to have gone on to 350 years. What’s going on? The imperial household presumably was exclusive but large. They married cousins all right, but that range of choice soon exceeded the critical number that can be survived. At the end they all ran out of children – or ran out of a sufficient number of capable children – and the dynasty fell.
Notice the notch slightly before the end. For about fifty years the dynasty is somewhat more vulnerable, but it then recovers. Implicitly there was a fertility crisis that then passed. I think a reasonable person might well shout, “Noise.” It could just be a statistical fluke.
If this were the only data, I would totally agree. But as the data sets pile on, that explanation will become untenable.
What I don’t know is whether this notch is caused by the same thing as the notch in the Denmark data. You remember that, of course. Just where the degree of kinship should be producing the greatest fertility, there is a little decline:
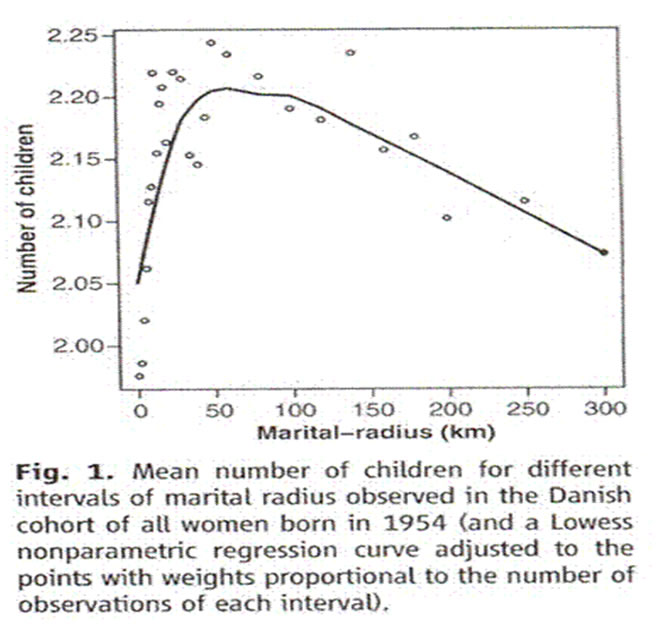
Comment on “An Association between Kinship and Fertility of Human Couples,” Rodrigo Labouriau and António Amorim, SCIENCE vol. 322 no. 5908 December 12, 2008 page 1634. For the whole story also see Human Fertility Increases with marital radius. Rodrigo Labouriau and António Amorim. GENETICS volume 178 January 2008 page 603.
This used to annoy me considerably, since it seemed to mar the beauty of the Sibly curve. But I don’t know. That curve is fertility against kinship, the present curve is survival (as a surrogate for fertility) against time. If there is a causal connection I should dearly love to have it explained. Instead we shall go on to Japanese dynasties.